Formal Metrics
A review of formal metrics for quantifying "division" or "polarization".
Our aim with this work is to improve our capacity to develop systems that satisfy the bridging goal: an increase mutual understanding and trust across divides, creating space for productive conflict, deliberation, or cooperation. Here we list metrics that have been used in related literature.
Context
The metrics are designed to summarize an abstract model of the public sphere, which we assume is either a graph (e.g. figure A, or a network of Twitter followers) or a set of points in Euclidean space (e.g. figure B, or user embeddings on a social media platform).
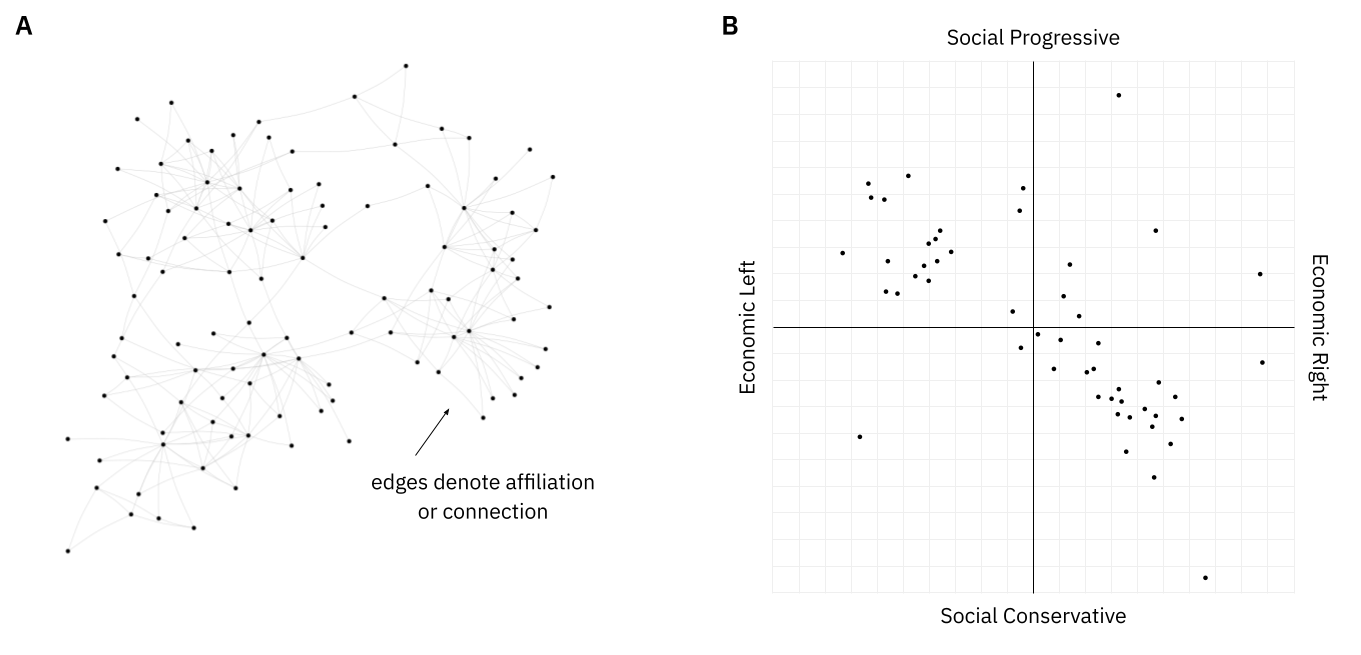
As per the terminology introduced in the paper, these are examples of relation metrics, because they summarize the state of a relation model at a give point in time. In contrast bridging metrics—not yet reviewed here—summarize a change in relation metrics over time.
Caution
While the metrics below are presented as possible measures of this “bridging goal”, most are obviously not plausible measures. The best we can say about them is that we do not yet know whether they are good measures. For this reason, none of the metrics on this page should be used as optimization targets in an attention-allocator (such as a social media platform) without considerable care to monitor and avoid unintended consequences.
Also, note that these metrics are simply summaries of the structure of some abstract model, such as a graph-based or space-based relation model. The provenance or “semantics” of the underlying relation model is also important to consider. For example, a given metric may be an excellent measure of the bridging goal when applied to a relation model that captures goodwill between people, but be a poor measure when applied to a relation model that captures similarities in people’s patterns of engagement on social media. At present, we know very little about which types of relation models and which relation metrics can be validly used as a basis for bridging.
Table of Metrics
To toggle fullscreen mode, use your Esc key or the purple button in the table.
|
Metric
|
Intuition
|
Scope
|
Model Type
|
Structure Required
|
Safe to Optimize?
|
Formula
|
References
|
|---|---|---|---|---|---|---|---|
| node-level homophily | The proportion of a vertex's neighbours which are in its own group. | individual | graph |
groups
| No |
|
Currarini et al. (2009), Interian + Ribeiro (2018), Reese et al. (2007), Interian et al. (2022) |
| group-level homophily | An average measure of the degree to which vertices in a group are connected to vertices in their own group, rather than others. | sub-group | graph |
groups
| No |
|
Lelkes (2016), Currarini et al. (2009), Interian et al. (2022) |
| population homophily | An average measure of the degree to which all vertices are connected to vertices in their own group, rather than others. | population | graph |
groups
| No |
| |
| modularity | The number of intra-group edges in the graph minus the expected number of intra-group edges in a graph with the same nodes, groups and degrees, but with edges placed at random. (Up to a multiplicative constant.) | population | graph |
groups
| No |
|
Newman (2006), Zhang et al. (2007), Wolfowicz et al. (2021), Garcia et al. (2015), Dal Maso et al. (2014), Interian et al. (2022) |
| E-I index | The difference between the proportions of edges that are inter- and intra-group. | population | graph |
groups
| No |
| |
| random walk controversy | Given that two random walks ended in different groups, the difference between the probability that they started from those same groups and the probability that they started from different groups. | population | graph |
groups (exactly 2)
| Maybe |
|
Garimella et al. (2018), Garimella et al. (2016), Cossard et al. (2020), Rumshisky et al. (2017), Emamgholizadeh et al. (2020), Interian et al. (2022) |
| node-level random walk controversy | The probability that a random walk which ends in one group started at the vertex of interest, relative to the same value for other groups. | individual | graph |
groups
| No |
|
Garimella et al. (2018), Garimella et al. (2016), Cossard et al. (2020), Rumshisky et al. (2017), Emamgholizadeh et al. (2020), Interian et al. (2022) |
| degree of balance | Degree of consistency with properties such as "my friend's friend is my friend" and "my friend's enemy is my enemy". | population | graph |
signed edges
| Maybe |
| |
| line index of balance | Minimum number of edge modifications that must be made to be perfectly consistent with properties such as "my friend's friend is my friend" and "my friend's enemy is my enemy". | population | graph |
signed edges
| Maybe | Not easily notated—see references. | |
| point index of balance | Minimum number of vertices which must be deleted to be perfectly consistent with properties such as "my friend's friend is my friend" and "my friend's enemy is my enemy". | population | graph |
signed edges
| Maybe | Not easily notated—see references. | |
| diameter | The maximum distance between any two points. | population | space | No |
| ||
| volume | The volume of the minimal convex polytope that includes all points. | population | space | No |
| ||
| mean difference | Average pairwise distance between any two points. | population | space | No |
| ||
| average absolute deviation | Average distance between each point and the mean. | population | space | No |
| ||
| standard deviation | Scalar standard deviation of the set of points. | population | space | No |
| ||
| variance | Scalar variance of the set of points. | population | space | No |
| ||
| coefficient of variation | Scalar standard deviation divided by the mean. | population | space | No |
| ||
| coverage | The number of distinct attitudes held or the variety of attitudes that at least one person in the population holds. | population | space |
bounded space
| No |
| |
| fragmentation | The number of groups. | population | space |
groups
| No |
| |
| mean group significance |
Average pairwise | population | space |
groups
| No |
| |
| mean group distance | Average pairwise distance (using a probability metric) between the distributions of groups. | population | space |
groups
| No |
| |
| (multi)modality | The extent to which a distribution is bimodal or multimodal. | population | space | No | There are a number of existing measures—see references. |
Knapp (2007), Nason + Sibson (1992), Bramson et al. (2016), Bramson et al. (2017) |
|
| divergence of means | Average pairwise distance between group means. | population | space |
groups
| No |
| |
| deviation from means | Average distance between an individual and the mean of their group, averaged across groups. | population | space |
groups
| No |
| |
| size parity | A measure of polarization based only on the proportions of points in each group. | population | groups |
groups
| Maybe |
|
Notation
Here, we introduce the notation used in the formulae in the above table. The notation differs by model type.
Graph
Let
There are a few more specific notations that are only used in a small number of metrics.
- For a given
- If
Space
Let